GitHub City: 3D Visualization
About
While working on GitHub visualizations I had a divergent idea of representing activity on github as a live interactive city. I followed up on that idea in 2014 to build a 3D visualization.
Application
Check out the application at: GitHub City
VR Exploration
In early 2016 I thought creating a VR project over a weekend would be fun. I used this project as a base, check it out: GitCity VR
Background Research and Data Gathering
I started with understanding how cities have grow. I found two broad categories: a preplanned city and an organic growth. However even the planned cities tend to face unseen circumstances and end up with some form of organic growth. Another important aspect of a city is the activity that happens in it at any given time. I used these 2 characteristics (growth and activity) as base for the design. Next step was to start gathering data, I used Mozilla on GitHub as my source. The data gathering itself took a few weeks.
Design
The main forcus of design was to translate 'growth' and 'activity' into conceptual representation.
Growth: I had made sure the data gathered was additive, which made vertical growth easy to represent. Horizontal growth, however, was a challenge as the data did not have any location information, but growth was time dependent. I already had time represented horizontally, I combined it with project creation which solved the location problem.
Activity: By definition activity meant showing movement. Projects, by nature, would not move; the people who worked on those projects could. People also moved between projects, or just work on a project then move out to another open source company. Even if a person works on the same project for years they move around as they would in a building.
Visual sorting: A big part of open source communities is the variety of languages, I used color coding to visually group projects together. Also a person working on an open source project could be part of the company or an external contributor, this was color coded as well (green: internal, yellow: external)
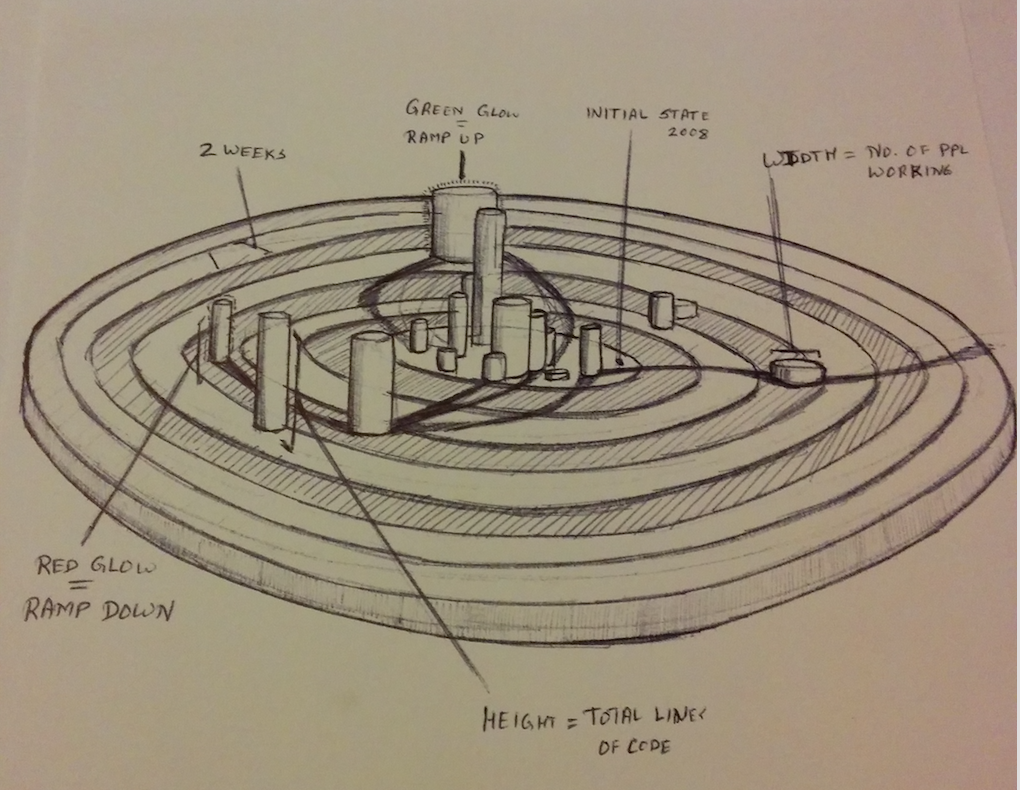
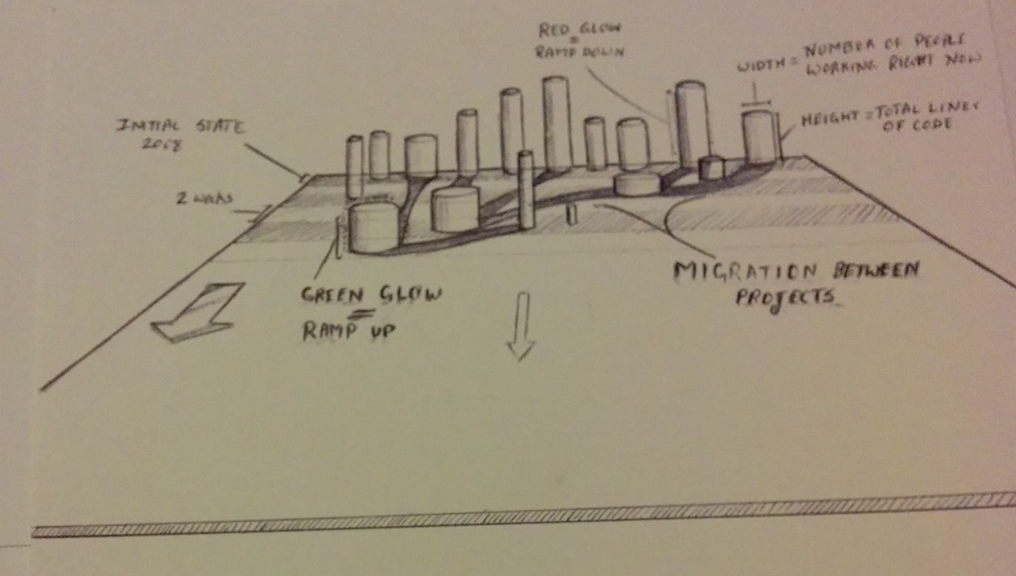
Growth Revisited: The second part of growth was layout. Depending on geography a city could grow in all directions (circular) or single direction (linear). I sketched and prototyped the two concepts to get feedback, the rectangular layout was easier to understand but most people thought I was creating 3D bar charts. The circular representation of time was slightly complicated but it made the overall idea easy to grasp.
Concept Sketches
Research and Iterations
I conducted research where I asked participants to think aloud while interacting with the prototype. While most people got the overall concept, they found it hard to complete finer tasks. In further iterations I added filters which made the prototype easier to interact with.
Learnings
In retrospect, I spent too much time perfecting the conceptual representation and very little time on the micro interactions that users actually performed. This coupled with unfamiliarity of 3D navigation made the design error prone. If I had to revisit this project I'd start with the micro interactions.